gcsescience.com 8 gcsescience.com
How can a Distance - Time
Graph
be used to show the Motion of an Object?
You may be shown a graph like the
one below
and be asked to describe the
motion of the object.

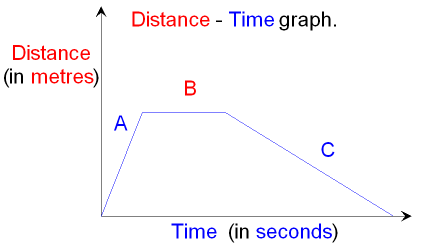
In region A the object is moving with constant velocity.
In region B the object is at rest (not moving).
In region C the object is again
moving with a constant velocity
but compared with region
A
1. the object is moving more slowly
because the slope is less
steep
2. the object is moving in the opposite direction
because distance is decreasing as time
goes by.
Compare this with the velocity - time on page 11.
![]() Links
Forces and Motion
Calculations
Revision Questions
Links
Forces and Motion
Calculations
Revision Questions
![]()
gcsescience.com Physics Quiz Index Force Quiz gcsescience.com
Home GCSE Chemistry GCSE Physics
Copyright © 2015 gcsescience.com. All Rights Reserved.