gcsescience.com 26 gcsescience.com
What are Energy Level Diagrams?
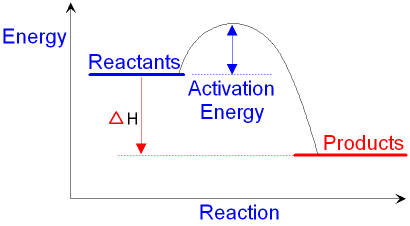
The change in
energy of a chemical reaction can
be plotted
against its progress as the reactants turn into products. The
energy level diagram for an exothermic
reaction is shown below.
Going from the reactants to the top
of the curve,
we are going up the energy axis of the graph.
Energy (heat) is
being put in to break
bonds in the reactants.
At the top of the curve, the
bonds in the reactants
have been broken. The amount of energy
put in
to break these
bonds is called the activation
energy.
The activation
energy is the minimum amount of energy
needed for the
reaction to occur. A catalyst
can
work by lowering the activation energy for
a reaction.
Going from the top of the curve to
the products,
we are going down the energy axis of the graph.
Energy (heat) is given
out as bonds
form in the products.
The reactants are higher
up the energy
axis
than the products. The amount of energy (heat)
you need to put
in (the activation energy) is
less than the amount of energy
(heat) you get
out.
This is a typical exothermic
reaction.
The difference in
energy levels between
the reactants and the products
is given the symbol ΔH (pronounced 'delta H').
This is the amount of heat that is
given out
or taken in during a chemical
reaction.
For an exothermic reaction, ΔH is negative.
For an endothermic reaction,
ΔH is positive.
![]() Links
Catalysts and Energy
Enzymes
Revision Questions
Links
Catalysts and Energy
Enzymes
Revision Questions
![]()
gcsescience.com The Periodic Table Index Energy Quiz gcsescience.com
Home GCSE Chemistry GCSE Physics
Copyright © 2015 gcsescience.com. All Rights Reserved.