gcsescience.com 14 gcsescience.com
Elements, Compounds and Mixtures
What happens to the Temperature
of a Solid
as it Melts to become a Liquid?
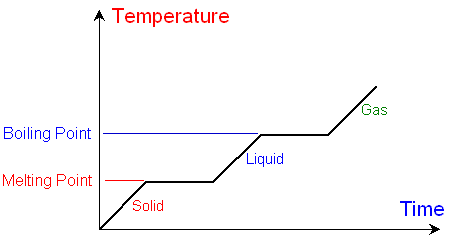
The graph
below shows how the temperature
changes with time
as a substance is heated at a constant
rate. There are obvious
horizontal flat sections of the
graph at the melting and boiling point.

Below the melting point
the substance is a solid.
Above the melting point the substance
is a liquid.
At the melting point,
although the substance is still being heated,
there is a time when the temperature does not
change and the
graph is horizontal.
During this time, all the extra heat
which is
being added
goes to overcome the force of attraction
(the bonds)
between the particles of the solid as it turns into a
liquid.
The process of melting requires
extra energy - it is endothermic.
The temperature of a solid can never be
raised
above
its melting point
at
atmospheric pressure.
When all
of the solid has melted, then the
temperature of the
liquid will start to rise
(continued on the next page).
![]() Links
Solid
Liquid
Gas
Revision Questions
Links
Solid
Liquid
Gas
Revision Questions
![]()
gcsescience.com The Periodic Table Index Chemistry Quiz gcsescience.com
Home GCSE Chemistry GCSE Physics
Copyright © 2015 gcsescience.com. All Rights Reserved.