gcsescience.com 11 gcsescience.com
Solubility Curves for Solids.
The amount of solid which
dissolves
in water at a particular temperature
is different for different substances.
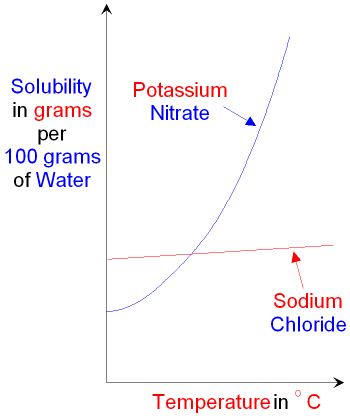
The graph below shows the solubility
curves
for potassium nitrate and sodium
chloride.

The temperature range shown is approximately
0 to 70
°C.
There is very little change in the amount of sodium chloride
which dissolves over this temperature range
but a very big change in the
amount
of potassium nitrate which dissolves.
The two graphs are shown on the
same axes
so that you can compare them
easily.
The potassium nitrate and sodium
chloride
were not both dissolved
together in the same water.
Compare this with the solubility curve for
gases.
![]() Links
Water
Solubility
Revision Questions
Links
Water
Solubility
Revision Questions
![]()
gcsescience.com The Periodic Table Index Water Quiz gcsescience.com
Home GCSE Chemistry GCSE Physics
Copyright © 2015 gcsescience.com. All Rights Reserved.