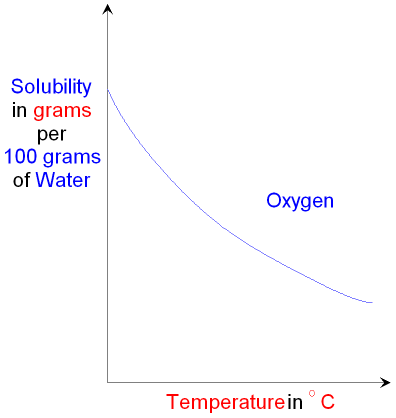
The temperature range shown is approximately 0 to 50 °C.
gcsescience.com 13 gcsescience.com
Solubility of Gases.
The solubility curve for gases is the opposite
of the solubility curve for
solids.
The solubility of a gas decreases as the
temperature increases.
The graph below shows the solubility
curve for oxygen
gas.

The temperature range
shown is approximately 0 to
50 °C.
Aquatic
life such as snails and
fish
depend on the amount of
oxygen dissolved in water.
Some power
stations use water as a
coolant
and may return warm water into a river.
This makes the amount of dissolved
oxygen in the river
decrease.
Aquatic life will die if the oxygen
level goes too low.
Carbon
dioxide can be dissolved in
water under pressure
to produce carbonated water which is
used in fizzy drinks.
The dissolved gas bubbles out of the water
when you open the bottle or can and
release the pressure.
Some carbon dioxide dissolves naturally in
water.
Chlorine can be dissolved in water to make bleach and kill bacteria.
![]() Links
Water
Solubility
Revision Questions
Links
Water
Solubility
Revision Questions
![]()
gcsescience.com The Periodic Table Index Water Quiz gcsescience.com
Home GCSE Chemistry GCSE Physics
Copyright © 2015 gcsescience.com. All Rights Reserved.